Remote Monitoring
Introduction
Remote monitoring is the process of supervising IT systems (such as network devices, desktops, servers and mobile devices) from a central management server. In general, monitoring improves reliability and security of your network because it facilitates early detection of erroneous conditions.
This document introduces various remote monitoring protocols and tools that can be used to remotely monitor Advantech cellular routers. As there is no single protocol that can monitor everything and no tool that supports all protocols, a combination of protocols and/or tools needs to be carefully selected based on your needs.
Remote Monitoring Possibilities
Remote monitoring tools inform administrators about the overall system health, performance, and potential issues. In general, the monitoring tools use one or more monitoring protocols to retrieve information from the router device and then:
- Display textual and numeric status information.
- Chart historical values of numerical status information.
- Trigger warning — error alerts based on a status value.
As an inspiration, this section provides an overview of monitorable information in various scenarios. There is a performance cost associated with each monitored item, so you should keep the number of monitored items to a reasonable minimum. Only some of these scenarios will be relevant in your environment.
Identify Inventory
You may want to automatically maintain a list of all the equipment in your network, including various identifiers, such as:
- Product name and serial number.
- System architecture (such as ARMv5 or ARMv8).
- Custom system description.
- Firmware version, possibly indicating routers with unacceptably old firmware.
- Cellular IMEI, ESN, MEID or ICCID.
- Interface MAC addresses.
- SSID of the Wi-Fi Access Point.
View Operational Status
If your router is integrated into a dynamic environment, you may want to view current or past status information, such as:
- Geographical location and speed.
- Binary I/O status.
Monitor Cellular Data Consumption
If your router is using a metered cellular connection with a monthly budget (3G, 4G, 5G) you may want to ensure you don’t exceed the limit of your SIM card(s). Therefore, you may want to monitor:
- Which SIM card and/or mobile network operator is active?
- Amount of data uploaded and downloaded over each cellular network?
The monitoring system may also predict the data consumption till the end of the period and trigger a warning when the limit is likely to be exceeded.
Traffic Policing
You may even want to have deeper insights into the traffic passing through your router, such as:
- What clients (IP addresses) connect to what servers?
- Are there any unexpected (suspicious) nodes sending / receiving traffic?
- What clients send the highest amount of traffic?
Monitor Service Quality
If the connection quality is of a great concern, you may want to monitor various indicators of the service quality, such as:
- System up time.
- Strength and quality of the mobile network signal.
- Operational status and transmission statistics for each interface.
You may also want to trigger warning — error alerts based on a status value, such as:
- Insufficient strength or quality of the mobile signal.
- Connectivity outages (link down, ping failed).
- Excessive traffic over the cellular network.
- Excessive packet loss, error rate or ping latency.
- Clients frequently disconnecting from the Wi‑Fi AP.
By comparing these quality indicators across your router feet and over a longer period of time you may discover poorly performing routers, which may be due to:
- Error or misconfiguration (need for maintenance).
- Overload (need for system expansion).
Track System Health for Preventive Maintenance
If service continuity is of great concern, you can collect system statistics over time and identify long term trends even before they reach levels that would trigger an alert. You may want to detect situations such as:
- SSL certification near its expiration time.
- Increasing resource consumption (CPU, memory, storage, number of processes).
- Increasing device temperature.
- Increasing drift of system local time.
- Repeated reboot in a short period of time.
- Decreasing input voltage, when battery is powered.
Intrusion Detection
You may want to use monitoring as a lightweight Intrusion Detection System (IDS) and discover events such as:
- Unexpected reboot.
- Unsuccessful or unexpected login attempts.
- Unsuccessful firmware upgrade, either manual or automatic.
- Uncommonly opened TCP/UDP listening ports.
- Changes to the router configuration or to other sensitive files (private keys, "/etc/passwd").
- Connection and/or disconnection of USB devices.
Monitoring Protocols
Remote monitoring protocols are used by the monitoring tools to retrieve status information from the monitored devices, such as routers. The monitoring tools then display information aggregated from multiple sources, draw charts or trigger alerts when a threshold is exceeded.
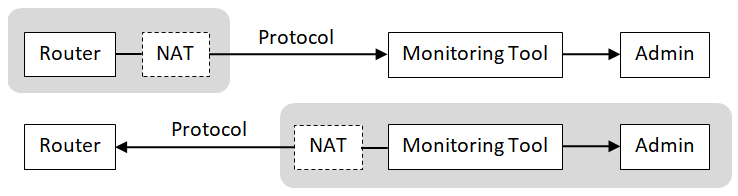
In general, there are two approaches to monitoring:
- Active monitoring, when the router initiates data transmissions to a monitoring tool.
- Passive monitoring, when the router listens for queries initiated from the tool.
Only the host that initiates the transmission may be behind NAT. If a passively monitored router or the server for active monitoring is behind NAT, a port forwarding rule needs to be configured.
Caution
Deploy the monitoring server to the LAN. Never transport any monitoring protocol unprotected via a public Internet.
The remote monitoring network protocols supported by Advantech routers are listed in the following sections.
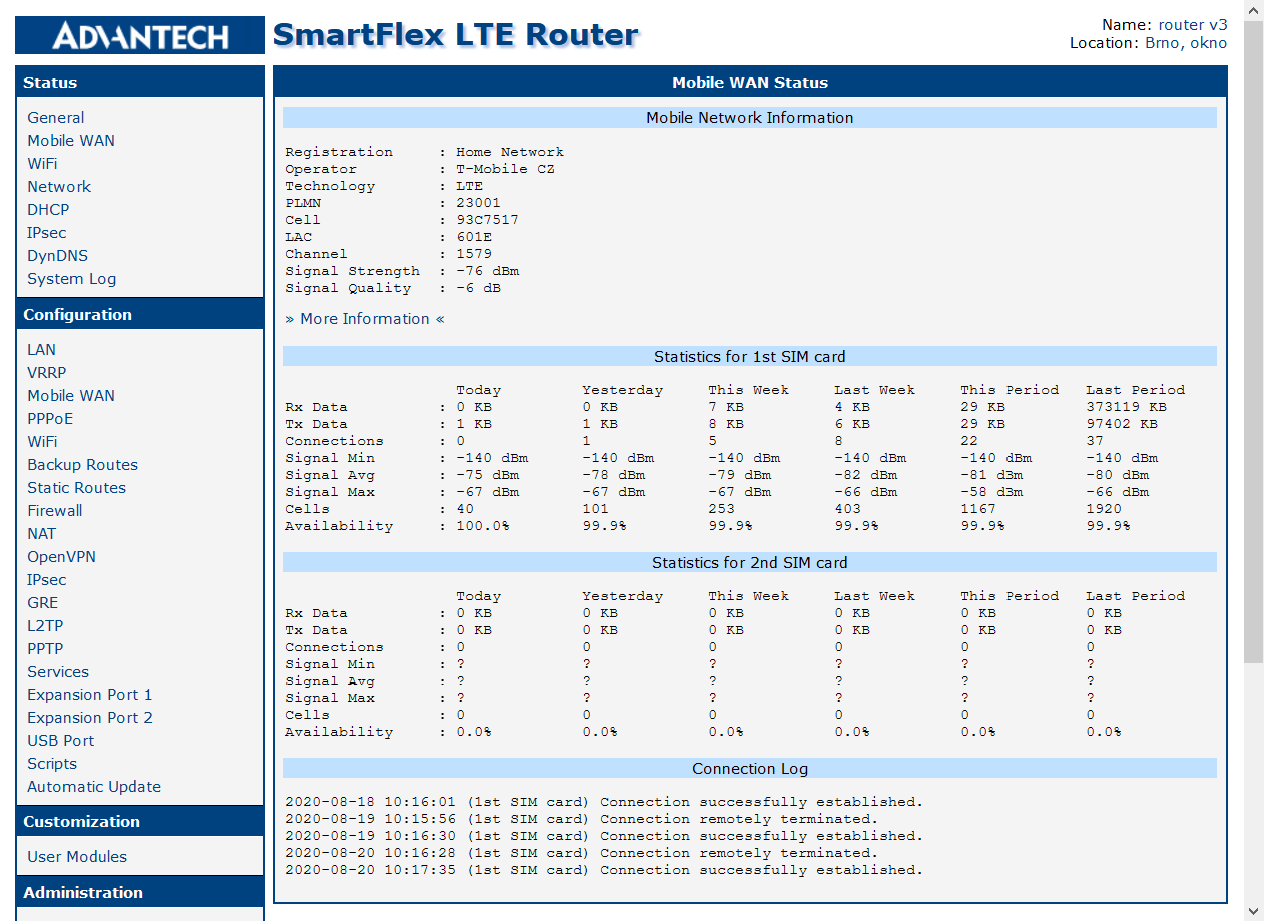
Web Interface (HTML/HTTP)
The router can be configured using a password-protected Web interface. This interface can also be used for simple passive monitoring: the administrator connects to the Status pages and reads the information concerning this single router, such as:
- System information (firmware version, serial number, supply voltage, temperature, local time and uptime).
- Mobile network information (current operator, technology, signal strength and quality, IMEI and ICCID) and connectivity statistics (amount of data received/transmitted, signal quality min/max/average).
- Network interfaces (addresses, status and statistics).
- Active DHCP leases and IPsec tunnels.
- Local syslog entries.
SMS Notifications
Short Message Service (SMS) is a text messaging service offered by most cellular telephone networks. When the router is connected to a cellular network, SMS can be used for simple active monitoring: the router monitors its status and sends a notification SMS to a defined phone number upon significant events, such as:
- On power up.
- On connection / disconnection from a mobile network.
- When data limit has been exceeded.
- When a binary I/O change.
ICMP Ping
Internet Control Message Protocol (ICMP) is used to send error messages indicating a communication failure (e.g. when a destination host or service cannot be reached) and to test reachability of a host on an IP network by so‑called Ping.
ICMP Ping carries no data, so no confidentiality nor integrity protection is needed.
To test router reachability you can:
- Ping the router from a remote machine (passive monitoring), and/or
- Install the Pinger Router App and ping a remote machine from the router.
Note that a successful ping does not indicate the router is in good condition; it only indicates the router can be reached over the network.
Syslog
System Logging (Syslog) protocol is a standard protocol used to send system log or event messages to a specific server. The transmission is initiated by the router (active monitoring).
The basic UDP protocol has no confidentiality nor integrity protection. Use it in secured networks only. Syslog export gets enabled if you set a Remote IP Address in your Syslog Configuration. If you need to secure the syslog traffic, install the Secure Syslog Router App and use SSL/TLS as the transport Protocol.
Since firmware 6.3.0 the Advantech cellular routers follow the BSD syslog Protocol defined in RFC 3164. Each message includes:
- Priority number, which is calculated from:
- Software type (called facility) that generated the message, see table below.
- Severity level, such as Error(3), Warning(4) or Notice(5).
- Timestamp
- Originating process
- Textual message
For example, info(6) from the auth(4) facility has a priority calculated as 38 = 4×8+6:
<38>Jul 27 13:41:29 https: user 'root' logged in from 192.168.1.1In the local syslog, the priority is omitted and the timestamp has a different, more readable format:
2020-07-27 13:41:29 https: user 'root' logged in from 192.168.1.1The following table contains an overview of significant router events and corresponding facility as defined by RFC 3164.
| Event | Facility |
|---|---|
| Firmware update | user(1) |
| Status changes of router services (dhcp, dns, …) | daemon(3) |
| Login success / failures Router configuration changes | auth(4) |
| Status of the Pluggable Authentication Modules (PAM) | authpriv(10) |
| Executed FTP commands | ftp(11) |
SNMP
Simple Network Management Protocol (SNMP) is a standard protocol for network monitoring. Data entries are exposed as objects, each identified with an Object ID (OID). The objects are organized hierarchically into a Management Information Base (MIB). SNMP can be used by the server to query (passive monitoring) and sometimes even modify individual objects (scalars) or sub‑hierarchies (tables).
The SNMP v1/v2 has no confidentiality nor integrity protection. SNMP v3 provides both authentication and encryption (privacy).
To use SNMP you need to check the Enable SNMP agent box and either the Enable SNMPv1/v2 access or Enable SNMPv3 access box in your SNMP Configuration. SNMP v1/v2 is enabled by default.
The MIB of Advantech cellular routers contains the following status and inventory information:
- Basic system information (name, description, admin contact, etc.).
- Hardware identifiers (S/N, IMEI, ICCID number, etc.).
- List of interfaces and related UDP or TCP/IP statistics.
- Hardware status information (temperature, voltage).
- Mobile connectivity status and statistics.
- Geographical location.
- Status of I/O ports.
A detailed list of all values that can be monitored via SNMP is described in the SNMP Object Identifiers Application Note.
SNMP Traps
SNMP trap is an asynchronous message triggered by the router either regularly or upon an event. Advantech cellular routers use SNMP traps for continuous regular reporting (active monitoring).
In general, the router does not send traps as alert messages in significant events; the syslog protocol is used instead. However, a few router apps (e.g. the Pinger Router App) can be configured to send SNMP traps in erroneous conditions.
Regular reporting using SNMP traps is enabled if you check the Enable reporting to supervisory system item in your SNMP Configuration and enter the target IP Address and reporting Period.
Each SNMP trap contains the following status information:
- Very basic interface statistics.
- Mobile connectivity status and statistics.
- Hardware status information (temperature, voltage).
Once every 24 hours the trap also includes the following inventory information:
- Basic system information (name, description).
- Hardware identifiers (S/N, IMEI, ICCID number, etc.).
See section 3 of the SNMP Object Identifiers Application Note.
SSH
Secure Shell (SSH) is a cryptographic network protocol used for remote login, remote command execution and secure file transfer (SCP). The connection is initiated by the server (passive monitoring).
The protocol provides both authentication and encryption. It is enabled by default, but it can be disabled in the SSH Configuration.
The monitoring tools use SSH to execute (possibly customized) scripts for retrieval of system-level parameters, such as memory or disk consumption. Note that the SSH checks can have a high impact on performance.
Caution
Routers contain a limited version of the shell, so some off‑the‑shelf scripts might not work.
NetFlow/IPFIX
Info
This protocol is not supported by routers of v1 production line.
NetFlow is a network protocol for collecting IP traffic information and monitoring network traffic. The connection is initiated by the router (active monitoring). There are several versions of the NetFlow protocol; the latest (v10) is called IPFIX (IP Flow Information eXport).
The protocol has no confidentiality nor integrity protection. Use it in secured networks only. To use NetFlow or IPFIX monitoring you need to install a specific Router App. See the NetFlow/IPFIX Router App.
The collected information includes:
- Timestamp when the traffic was first seen and last seen.
- Source and destination IP address and port.
- IP address of the next hop (for outbound traffic).
- Number of packets and bytes transmitted.
- Used protocol and TOS.
- Protocol-specific details such as TCP flags or ICMP message type.
Custom Agents
Several monitoring tools such as Zabbix or Nagios offer agents that can be deployed on the monitored devices. They support both active and passive monitoring and use proprietary protocols that offer both authentication and encryption.
They provide detailed OS monitoring, which includes:
- Network reachability.
- System hostname.
- Local time.
- Status of system resources (CPU, memory, storage, OS processes).
- List and status of network interfaces (addresses and packet/error statistics).
In addition, the agents can provide the ability to monitor custom values through command execution.
Recommendations
Minimum for Monitoring
You should monitor at least router availability so you can detect faults. This can be done either:
- By checking reachability of a LAN device behind the router, e.g. using the ICMP Ping, or
- By checking for unexpected drops in data throughput, e.g. using the SNMP ipForwDatagrams object (see SNMP Object Identifiers Application Note).
Unless the router is deployed in a trusted private environment, we also recommend monitor system logs for security‑relevant events, as described in the Security Guidelines. This can be done using Syslog or using Custom Agents.
Mind the Performance Impact
When you extend the set of monitored information beyond the recommended minimum, note that extensive monitoring may negatively impact your router performance.
Avoid monitoring too much information. Don’t try to do benchmarking. Let the monitoring system isolate a problem, then perform profiling and debugging using specialized tools on the hosts that really require it.
Avoid too frequent checks. Many parameters don’t change very often or very rapidly. Set the refresh rate of each item individually.
Avoid creating excessive problem noise by triggering too many alerts. This might overwhelm the user, causing them to lose focus on the most important metrics. Avoid triggers that are merely “for your information” or “this looks weird.”
Mind the Security Impact
By opening listening ports in the router for passive monitoring, you increase its exposure to network attacks. Please ensure that the monitoring interface is well secured.
Always use the latest firmware and the latest router apps with custom agents. Security flaws in old software versions might be exploited by attackers to compromise your router and/or your network.
Never send monitoring protocols that have limited security protection (such as Syslog, SNMP v1/2 or NetFlow/IPFIX) over the public Internet (WAN) unless a VPN is used. An unauthorized person might intercept, view, or even modify the information.
Advantech Monitoring Tools
Router Self-Monitoring
In the simplest case, the monitoring tool is integrated directly into the router, allowing network administrators to access status information from a Web browser. See the manual of your router, section Status.
The router can also be configured to send SMS notifications upon significant events, or to accept SMS commands such as "go online" or "reboot". See the manual of your router, section Configuration – Services – SMS.
Protocols: Web Administration, SMS Notifications
Operating system: Any
Difficulty: Easy
WebAccess/DMP
WebAccess/DMP Generation 2 is an advanced Enterprise‑Grade platform solution for provisioning, monitoring, managing and configuring Advantech routers and IoT gateways. See https://wadmp.advantech.com/ for more information.
Protocols: Custom Agent, active only
Operating system: Cloud‑hosted Solution‑as‑a‑Service
Difficulty: Easy
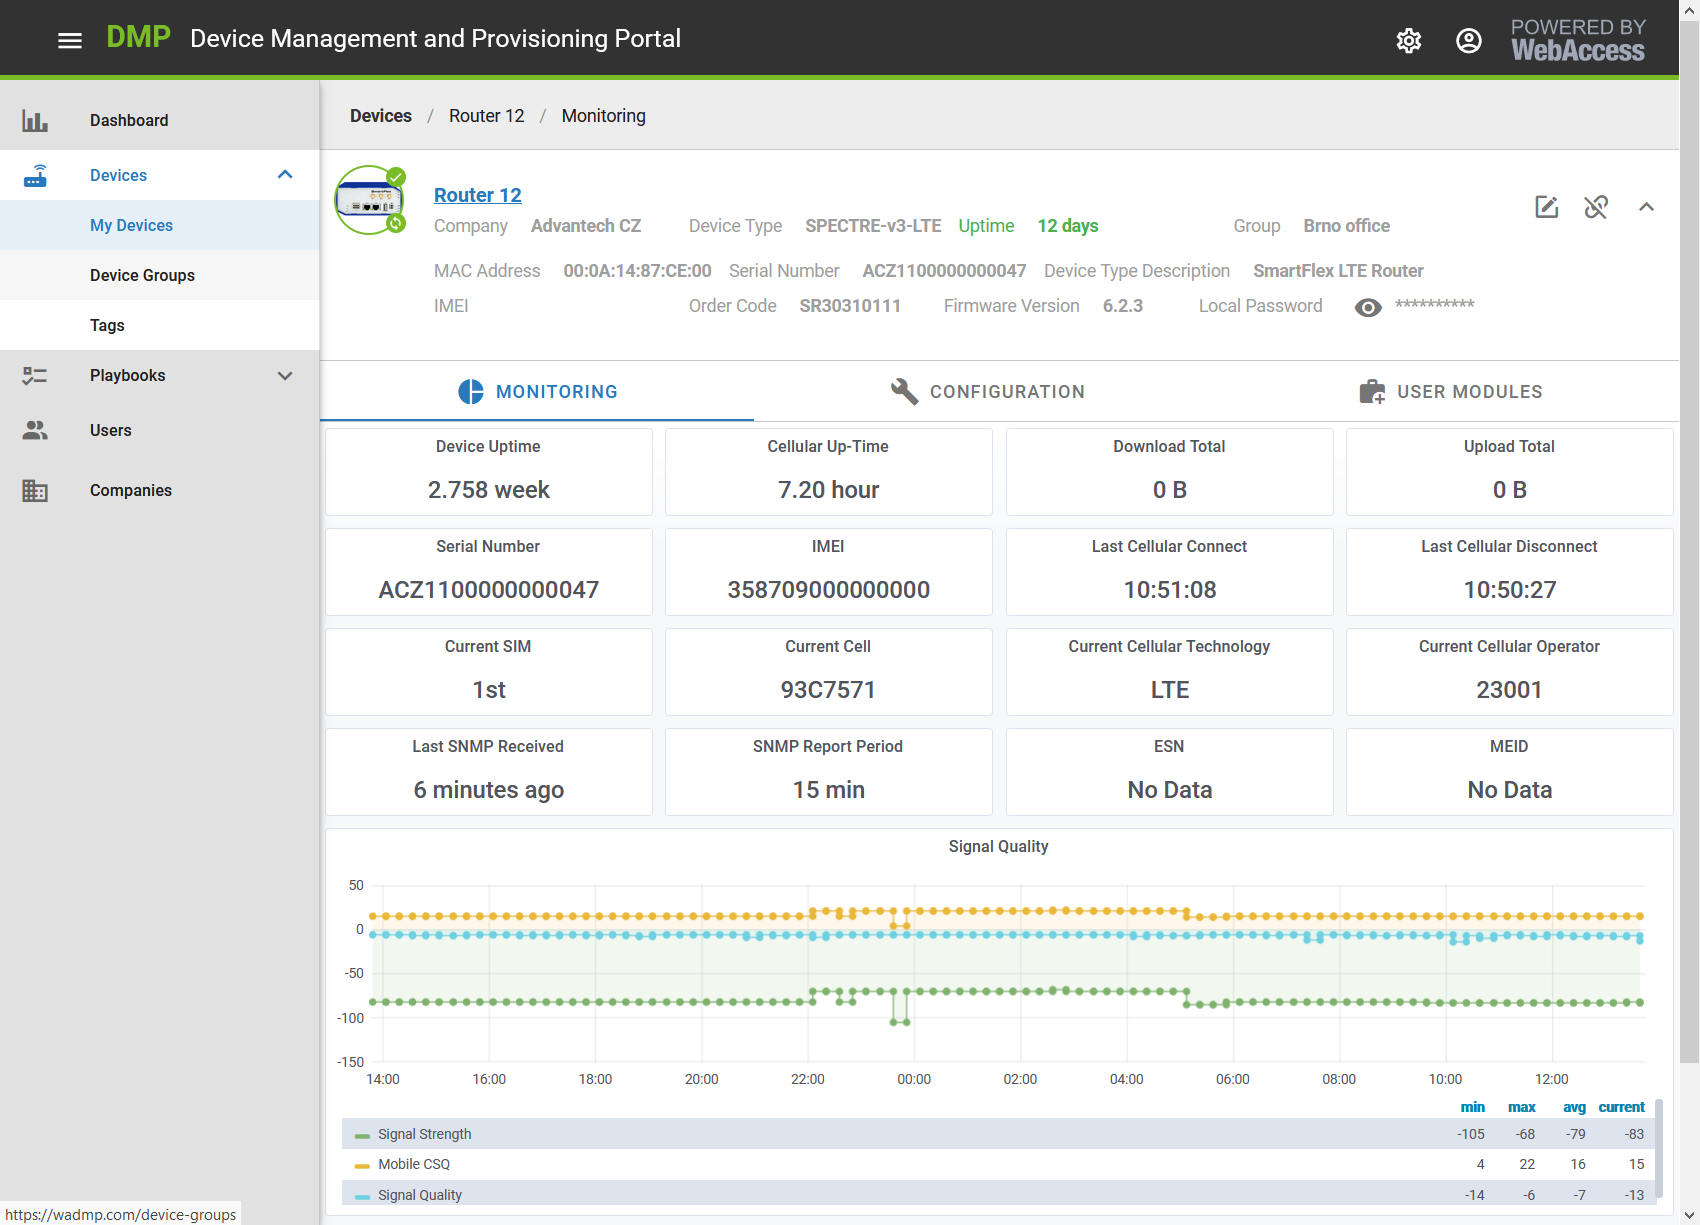
Every remote device has built-in secure health‑monitoring status indicators, which are reported to the server and stored in a time‑series database. You can view and analyze:
- Device inventory data (type, firmware version, serial number, IMEI).
- Connectivity status (cellular up‑time, total upload/download, current technology and operator).
- Charts of cellular data usage and mobile speed (download, upload), signal quality and strength, device temperature and voltage.
Third Party Monitoring Tools
Advantech cellular routers have been successfully integrated with several third party monitoring tools. Some examples are provided in the following sections (in alphabetical order).
Tips
This list is not exhaustive. Since our routers use standard monitoring protocols (as explained in the previous section), you may use these protocols with any monitoring tool of your choice.
When selecting a monitoring system you should consider:
- Do you want to monitor only Advantech routers, or your entire network?
- Do you want to host the tool on a Linux or a Windows machine?
- Do you want an easy installation, or are you willing to spend time tailoring the tool to your needs?
Cumulocity IoT
Cumulocity IoT is a cloud‑based subscription service that enables fast visibility and control over remote assets and the data they create. It offers device management features as well as powerful data analytics for search, diagnostic, and predictive analytics. For more information, see https://www.cumulocity.com.
Protocols: Custom Agent
Operating system: Cloud‑hosted Solution‑as‑a‑Service
Difficulty: Medium
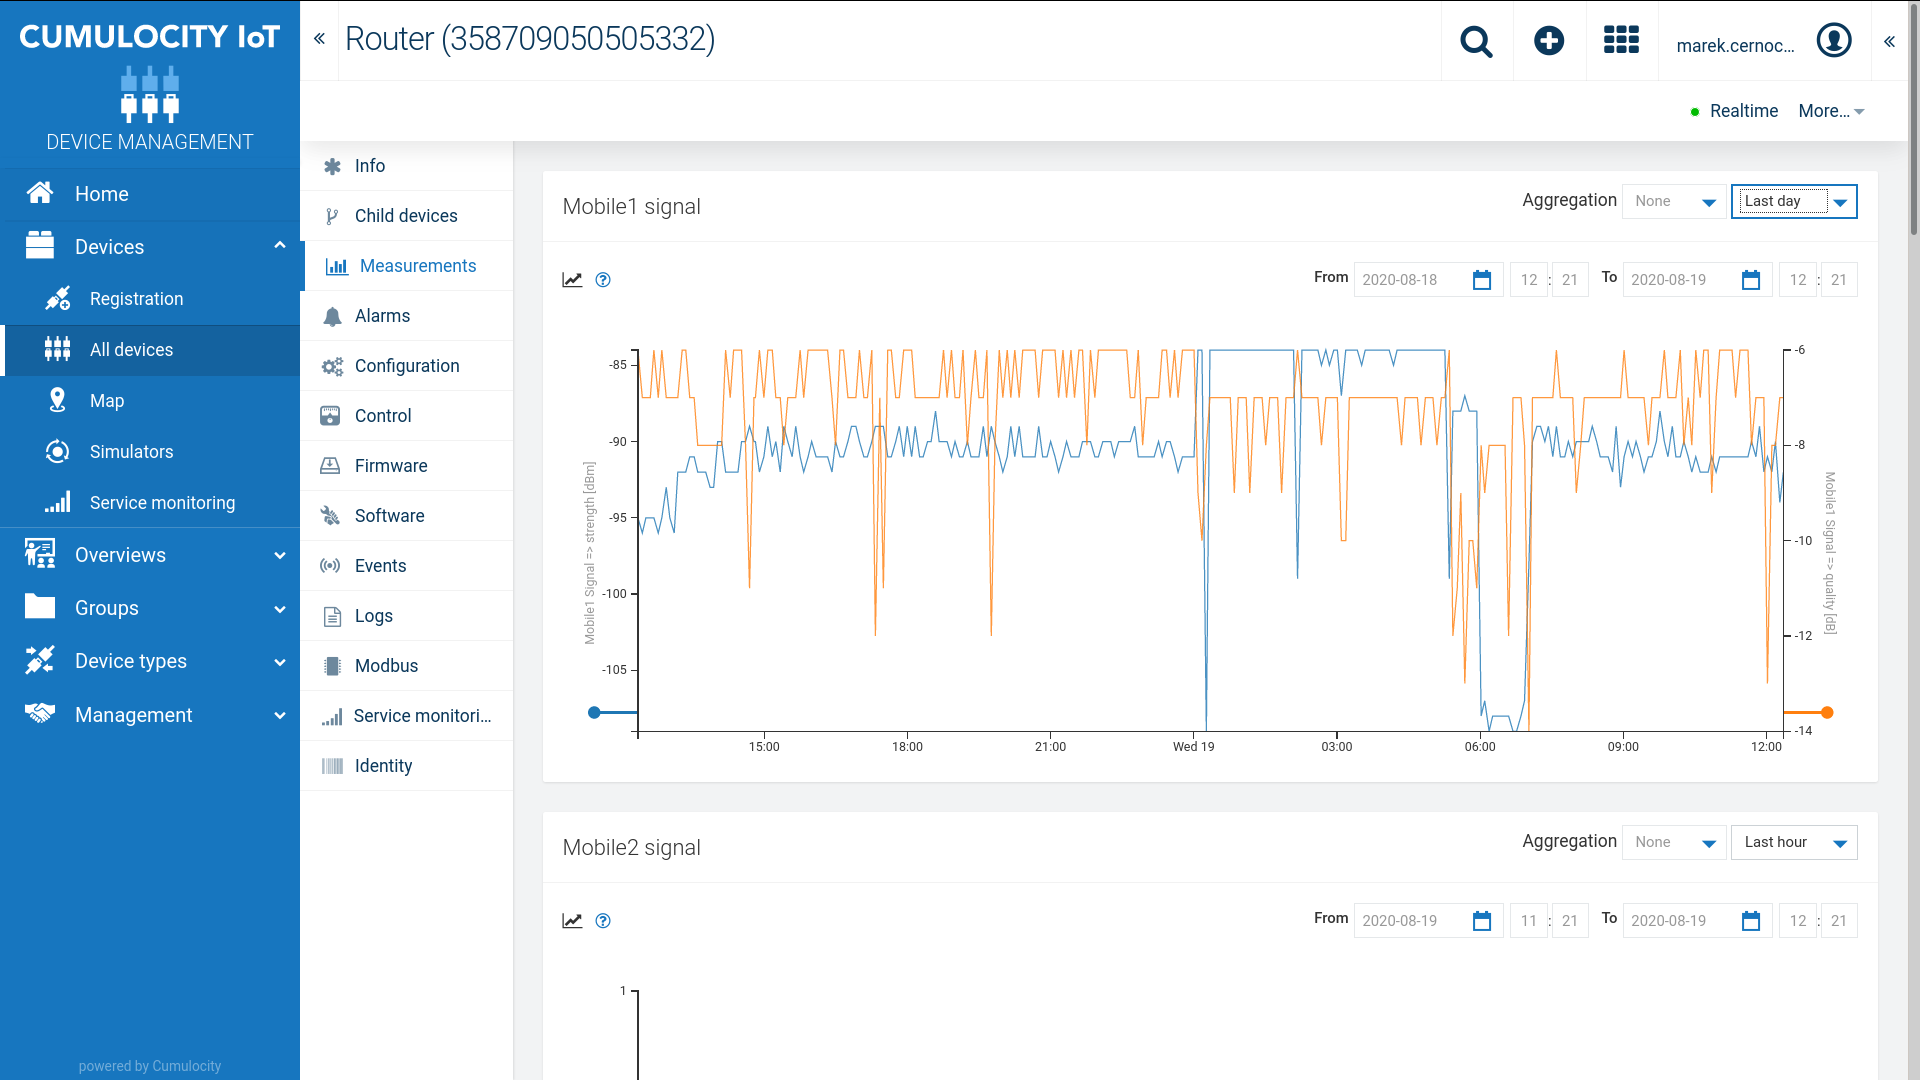
The Cumulocity Router App provides an agent that submits router status information to Cumulocity IoT, such as:
- Router inventory information (name, type, model, serial number, IMEI).
- Status information (CPU load, memory and storage usage, power supply voltage, temperature).
- Geographical location (when a GNSS receiver, such as GPS, is installed).
- Mobile connectivity status (signal strength, amount of data transmitted).
Users can easily implement retrieval of additional information by adding Lua (see http://www.lua.org) scripts to the Router App. See the Cumulocity Agent Router App for more details.
Graylog
Graylog is a log management software that centrally captures and stores log messages, enabling real‑time search and analysis of machine data from any component in the IT infrastructure and applications. For more information, see https://www.graylog.org/.
Protocols: Syslog
Operating system: Linux
Difficulty: Medium
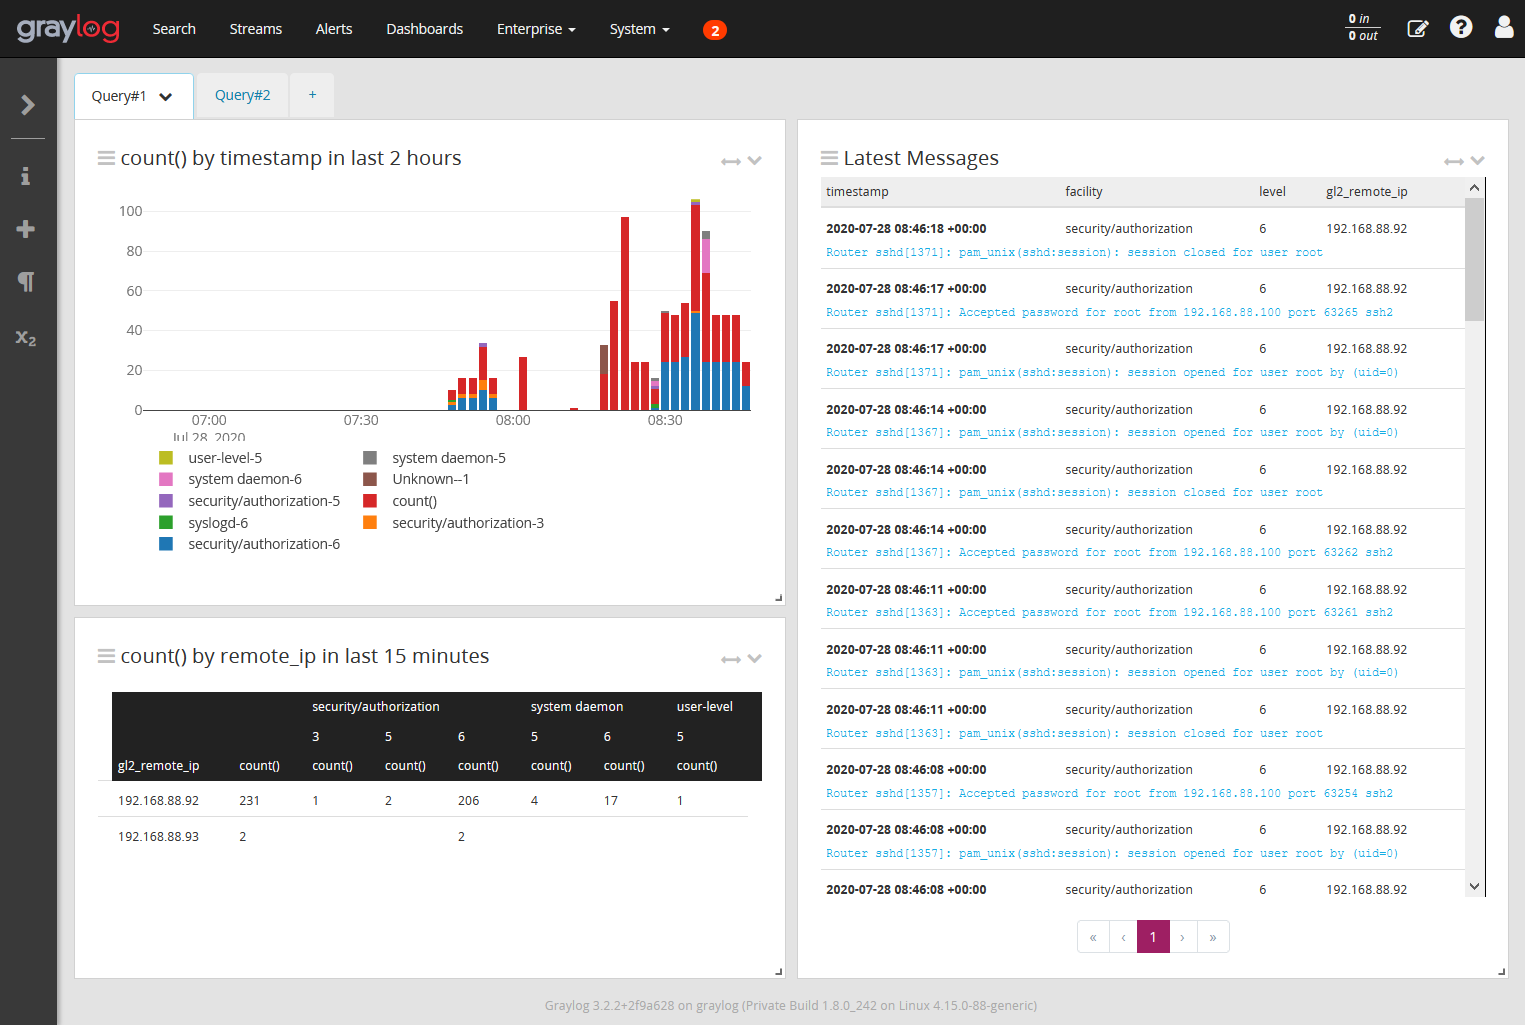
Graylog listens on UDP port 1514, so you need to change the Remote UDP Port in the router Syslog Configuration.
Caution
Make sure the current time (clock) of your routers and the clock of the Graylog server match. Messages may get lost if the clocks don’t match.
PRTG Network Monitor
PRTG Network Monitor (Paessler Router Traffic Grapher) is an agentless network monitoring software that can monitor and classify system conditions like bandwidth usage or uptime. It collects statistics from hosts such as switches, routers, servers, and other devices and applications. For more information, see https://www.paessler.com/prtg.
Protocols: ICMP Ping, Syslog, SNMP, SSH, NetFlow/IPFIX
Operating system: Windows
Difficulty: Easy
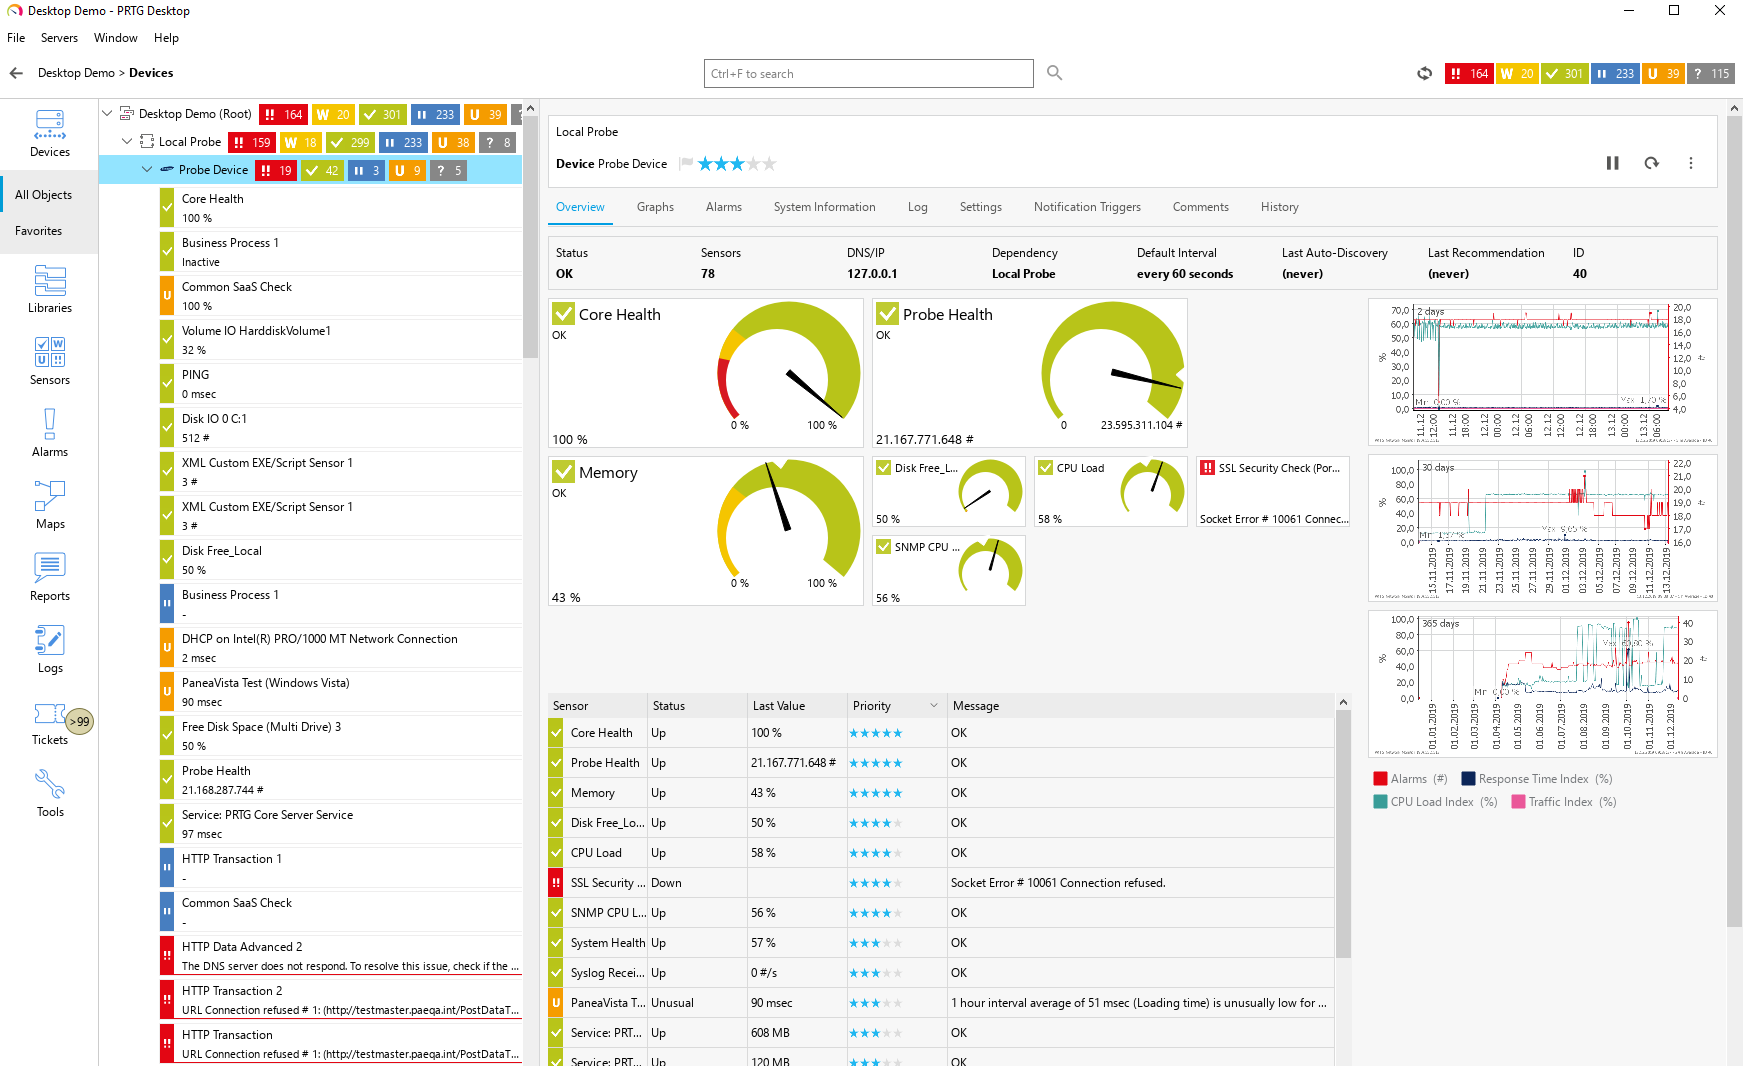
Each device is monitored by a set of individual probes. Each probe retrieves and monitors one specific characteristic using a specific protocol. Based on tests against PRTG 20.3.62, routers support the following probes:
- Ping, Ping Jitter.
- Traceroute Hop Count.
- Syslog Receiver.
- SNMP System Uptime, SNMP Traffic, SNMP Custom Advanced, SNMP Custom String.
- Port.
- SSL Certificate Sensor, SSL Security Check.
- HTTP, HTTP Advanced, FTP, sFTP (service availability).
- SSH Remote Ping, (custom) SSH Script.
- NetFlow/IPFIX.
Zabbix
Zabbix is an open‑source monitoring software tool for diverse IT components, including networks, servers, virtual machines (VMs), and cloud services. It can monitor numerous network parameters as well as the health and integrity of servers. For more information, see https://www.zabbix.com.
Protocols: ICMP Ping, SNMP, SSH, Custom Agent
Operating system: Linux
Difficulty: Medium
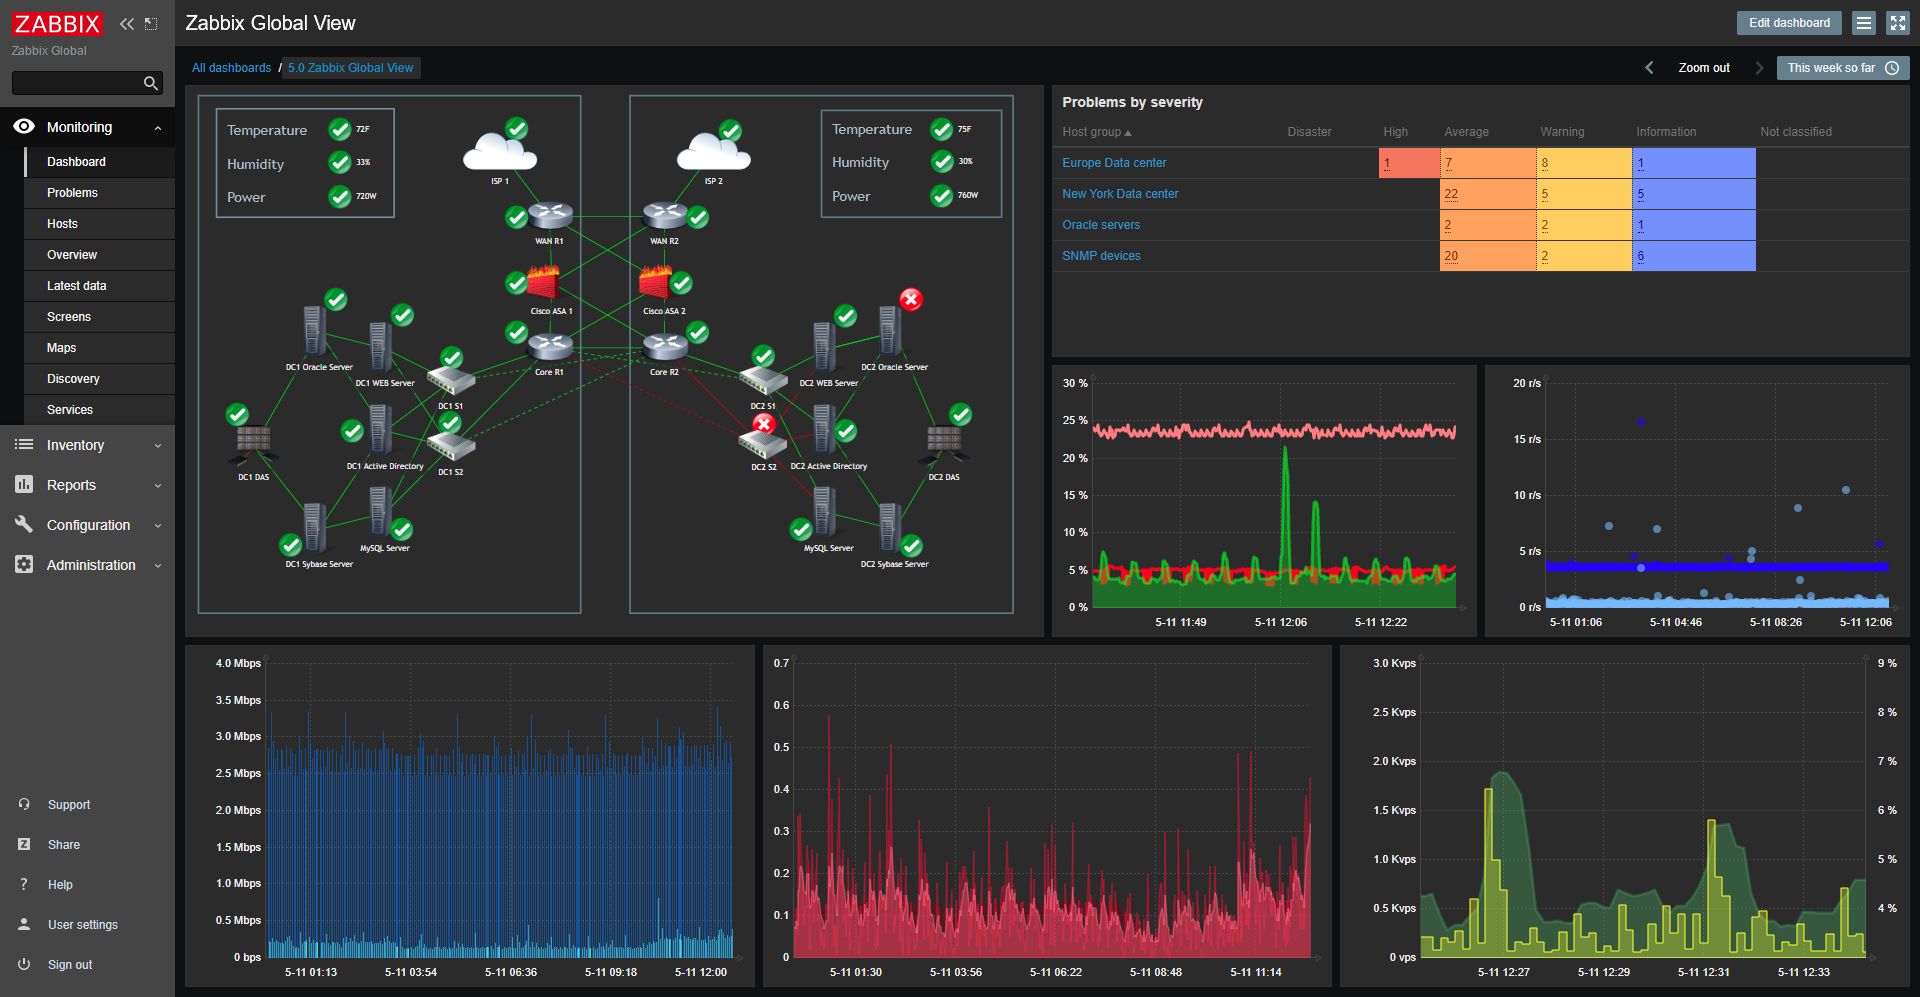
To simplify integration, we offer a Zabbix Agent Router App and a Zabbix template for the Conel MIB. Refer to the SNMP Object Identifiers Application Note. Both can be downloaded from the Zabbix Agent Router App page. Refer to the Zabbix Integration Application Note for more details.