Zabbix Agent
Quick Setup Guide
This chapter provides a minimal set of steps required to start monitoring an Advantech router using Zabbix. For detailed configuration options, refer to the corresponding sections.
Tips
For simple monitoring, use SNMP. For advanced metrics and custom checks, use the Zabbix Agent Router App.
Install Zabbix — Deploy and start a Zabbix server (for example, using the official virtual appliance). Ensure that the Zabbix web interface is accessible. Refer to the Server Installation section.
Import templates — Import the Advantech YAML templates into the Zabbix web interface. These templates provide predefined items, triggers, and discovery rules. Navigate to Data collection → Templates → Import. Refer to the Advantech Templates section.
Configure router — Enable and configure the monitoring interface on the router: SNMP (for basic monitoring) or the Zabbix Agent Router App (for advanced monitoring). Ensure that network communication between the router and the Zabbix server is allowed. Refer to the Router Configuration (SNMP) or Router Configuration (Zabbix Agent) sections.
Add host — Create a new host in the Zabbix web interface, assign the appropriate template(s), and configure the correct interface type (SNMP or Agent). Refer to the Configuring a Host in Zabbix section.
Verify data — Confirm that monitoring data is being collected:
- Verify that the host availability indicator is green.
- Review collected metrics in Monitoring → Latest data.
If no data is displayed, verify connectivity, configuration, and update intervals. See also the Troubleshooting section.
Zabbix Basics
Introduction
Zabbix is an enterprise-grade, open-source monitoring platform designed to track the performance and availability of IT infrastructure, including networks, servers, virtual machines, and cloud services.
It uses a client-server architecture, where a centralized Zabbix server collects, processes, and evaluates data from monitored devices. It can monitor a wide range of network parameters as well as the overall health and integrity of servers. For more information, visit zabbix.com.
The Zabbix server typically runs on Linux and supports a wide range of data collection protocols, including ICMP Ping, SNMP, SSH, and custom Zabbix agents.
Remote monitoring is the process of supervising IT systems from a central management server. In general, monitoring improves the reliability and security of a network by facilitating the early detection of erroneous conditions.
Tips
For an introduction to remote monitoring and a list of other monitoring tools, refer to the Remote Monitoring Advantech Application Note.
Possible Interfaces
For gathering Zabbix data from an Advantech router, the following interfaces can be used:
- SNMPv1/v2 — Retrieves predefined values via the SNMP protocol. This is the simplest way to implement data monitoring. Refer to the Using SNMP Polling section.
- Agent — Allows retrieval of additional and custom-defined items compared to SNMP. Requires the Zabbix Agent Router App to be installed on the router. Refer to the Zabbix Agent Router App section.
When to use SNMP vs. Zabbix Agent:
- SNMP → simple, low overhead, read-only
- Agent → advanced metrics, custom checks, active mode
Agent-based monitoring can operate in two modes:
- Passive mode — The Zabbix server initiates the connection and polls the agent. This increases server load and may not work well for devices behind NAT or firewalls.
- Active mode — The agent initiates the connection to the Zabbix server. This reduces server load and works reliably in NAT or firewall-restricted environments.
Advantech Integration Tools
There are two free tools designed to simplify Zabbix integration on Advantech routers. Neither is mandatory for Zabbix data collection to work, but both can be highly beneficial:
- Zabbix Templates File — A YAML configuration file containing preconfigured items and triggers based on the Conel MIB, as well as templates for the Agent interface. Refer to the Advantech Templates section.
- Zabbix Agent Router App — An application that can be installed directly on the router to enable advanced, agent-based monitoring in both passive and active modes. Refer to the Zabbix Agent Router App section.
Zabbix Server
Server Installation
The Zabbix server is the central component responsible for polling and trapping data, calculating triggers, and sending notifications. Regardless of the chosen scenario, a Zabbix server must be installed and running in your environment.
There are multiple options for installing a Zabbix server (zabbix.com/download). For small environments or testing, the easiest method is to deploy the pre-configured Zabbix virtual appliance.
VirtualBox can be used as a free virtualization tool. Download the pre-configured Zabbix virtual appliance (zabbix.com/download_appliance) in Open Virtualization Format (.ovf). An official manual is available at zabbix.com/documentation.
Once downloaded, open VirtualBox and import the appliance by navigating to File → Import Appliance...
Tips
- If the downloaded appliance is archived (for example, in a
.tar.gzformat), extract it first. This provides a directory containing the.ovfand.vmdkfiles. - The default network setting for the virtual machine is usually NAT. Depending on your network environment, you may need to configure port forwarding or change the adapter type to Bridged Adapter.
- If needed, use the
ip addrcommand in the guest console (Zabbix server) to find out the IP address assigned to the running server.
Start the virtual machine and allow the guest OS to boot. If you need to log in to the server console directly, use the following default OS credentials:
- Username:
root - Password:
zabbix
To access the Zabbix web interface (frontend), navigate to http://<ip_address> in your browser, where <ip_address> is the IP address of your Zabbix server. The default web interface credentials are:
- Username:
Admin(case-sensitive) - Password:
zabbix
Advantech Templates
The Advantech templates are stored in the zbx_icr_templates.yaml configuration file. They are based on the Conel MIB (Management Information Base) and include preconfigured items for SNMP retrieval. This file can be downloaded from the Zabbix Agent Router App page. The Conel MIB structure is described in detail in the SNMP Object Identifiers Application Note.
The YAML templates configuration file contains the following templates:
A) Retrievable via SNMP polling only (no Zabbix Agent Router App required):
- Advantech ICR Basic SNMP — Defines basic system, hardware, and network metrics.
- Advantech ICR Mobile 1 SNMP — Defines metrics related to the mobile connection, such as signal strength, data usage, and SIM card details.
B) Retrievable via Zabbix Agent Router App:
- Advantech ICR Resources by Agent — Defines system resource metrics (e.g., memory and storage usage) collected passively by the Zabbix server.
- Advantech ICR Resources by Agent active — Defines the same system resource metrics as the passive template, but uses active checks.
The following tables detail the contents of all templates. Populated Inventory indicates that the value retrieved by the given Zabbix item is automatically written to the system inventory of the respective host in Zabbix.
| Zabbix Item | Description | Populated Inventory |
|---|---|---|
| Firmware | Information about the device firmware version. | OS |
| GNSS satellites | Number of GNSS satellites currently visible to the router. | — |
| ICMP loss | Percentage of lost ICMP echo request packets. | — |
| ICMP ping | Availability of the device via ICMP ping (0 = unreachable, 1 = reachable). | — |
| ICMP response time | Response time to ICMP ping requests (in seconds). | — |
| Location altitude | Altitude of the device location above sea level (in meters). | — |
| Location latitude | Geographic latitude of the device location (in degrees). | Location latitude |
| Location longitude | Geographic longitude of the device location (in degrees). | Location longitude |
| Part number | Product part number assigned by the manufacturer. | Model |
| Product name | Product designation or model name. | Type |
| RTC battery | Status of the RTC backup battery (unknown, ok, empty). | — |
| Serial number | Unique serial number of the device. | Serial number A |
| SNMP agent availability | Availability status of SNMP communication (0 = unavailable, 1 = available, 2 = unknown). | — |
| SNMP traps (fallback) | Collects all SNMP traps not matched by other trap items. | — |
| System contact details | Contact information for the administrator of the device. | Contact |
| System description | Textual description including hardware type, OS, and software details. | — |
| System location | Physical location of the device (e.g., rack, room, building). | Location |
| System name | Administratively assigned device name (typically FQDN). | Name |
| System object ID | Vendor-specific identifier of the managed device type (OID). | — |
| Temperature | Internal device temperature (in °C). | — |
| Uptime (hardware) | Time since the device was last started (hardware uptime). | — |
| Uptime (network) | Time since the SNMP agent (network management) was last restarted. | — |
| Voltage | Input power supply voltage (in volts). | — |
Advantech ICR Basic SNMP template items
| Zabbix Item | Description | Populated Inventory |
|---|---|---|
| Mobile card | Index of the active SIM card (0 = primary, 1 = secondary, 2 = tertiary). | — |
| Mobile connections 1 | Number of connections established using the primary SIM card (daily counter). | — |
| Mobile connections 2 | Number of connections established using the secondary SIM card (daily counter). | — |
| Mobile inbound data 1 | Amount of data received via the primary SIM card (in bytes, daily total). | — |
| Mobile inbound data 2 | Amount of data received via the secondary SIM card (in bytes, daily total). | — |
| Mobile offline time | Total time the mobile interface was offline (daily value). | — |
| Mobile online time 1 | Total time connected using the primary SIM card (daily value). | — |
| Mobile online time 2 | Total time connected using the secondary SIM card (daily value). | — |
| Mobile operator | Name of the mobile network operator currently in use. | — |
| Mobile outbound data 1 | Amount of data transmitted via the primary SIM card (in bytes, daily total). | — |
| Mobile outbound data 2 | Amount of data transmitted via the secondary SIM card (in bytes, daily total). | — |
| Mobile registration | Current network registration status (e.g., idle, searching, home, roaming). | — |
| Mobile signal average | Average signal strength over the monitored period. | — |
| Mobile signal level | Signal strength indicator (CSQ value in range 0–31). | — |
| Mobile signal max | Maximum recorded signal strength over the monitored period. | — |
| Mobile signal min | Minimum recorded signal strength over the monitored period. | — |
| Mobile signal quality | Signal quality of the selected cell (in dB). | — |
| Mobile signal strength | Instantaneous signal strength (in dBm). | — |
| Mobile technology | Currently used mobile network technology (e.g., LTE, UMTS, 5G). | — |
| Mobile uptime | Time since the current mobile connection was established. | — |
| Modem IMEI | Unique IMEI identifier of the modem. | Serial number B |
| Modem SIM ICCID | ICCID (SIM card identifier) of the inserted SIM card. | — |
| Modem SIM IMSI | IMSI (subscriber identity) of the SIM card. | — |
| Strength threshold Fair | Signal strength threshold defining a fair-quality connection (technology-dependent). | — |
| Strength threshold Weak | Signal strength threshold defining a weak connection (technology-dependent). | — |
Advantech ICR Mobile 1 SNMP template items
The Fair and Weak strength thresholds are auto-calculated items that depend on the mobile technology in use. They are used by the signal strength triggers.
From the Mobile-2 OID tree, the Advantech ICR Mobile 1 SNMP template exclusively uses aggregated values from the MobileYesterday table. The MobileToday table is not used because it contains incomplete, constantly changing data. Long-term aggregated tables such as MobileThisWeek are not needed because Zabbix stores daily data and calculates its own long-term historical statistics.
| Zabbix Item | Description |
|---|---|
Checksum /etc/passwd | MD5 checksum of the /etc/passwd file, used to detect unauthorized changes. |
Storage / free | Available disk space on the root filesystem (in bytes). |
Storage /opt free | Available disk space on the /opt filesystem (in bytes). |
Storage /opt used | Used disk space on the /opt filesystem (in bytes). |
Storage /opt used % | Percentage of used disk space on the /opt filesystem. |
Storage / used | Used disk space on the root filesystem (in bytes). |
Storage / used % | Percentage of used disk space on the root filesystem. |
Storage /var/data free | Available disk space on the /var/data filesystem (in bytes). |
Storage /var/data used | Used disk space on the /var/data filesystem (in bytes). |
Storage /var/data used % | Percentage of used disk space on the /var/data filesystem. |
| System memory available | Amount of available system memory (in bytes). |
| System memory used | Amount of used system memory (in bytes). |
| System memory used % | Percentage of used system memory. |
Advantech ICR Resources by Agent template items
The Advantech ICR Resources by Agent active template contains the exact same items as the passive template. The difference is that its items are configured as active checks (Zabbix agent (active)).
A trigger is a logical expression that evaluates collected data and defines a condition or threshold. When incoming data meets this condition, the trigger changes its state (e.g., from OK to Problem) to generate an alert. The templates above define the following triggers:
| Template | Trigger Name | Condition |
|---|---|---|
| Advantech ICR Basic SNMP | System name has changed Host has been restarted No SNMP data collection | System name differs from previous Uptime < 10 min SNMP unavailable for 5 min |
| Advantech ICR Basic SNMP (ICMP) | Unavailable by ICMP ping High ICMP ping loss High ICMP ping response time | ICMP ping fails (timeout) {$ICMP_LOSS_WARN} < ICMP loss < 100% ICMP response time > {$ICMP_RESPONSE_TIME_WARN} |
| Advantech ICR Basic SNMP (Network Interfaces) | Interface {#IFNAME}: Link down Interface {#IFNAME}: High bandwidth usage Interface {#IFNAME}: High error rate Interface {#IFNAME}: Ethernet has changed to lower speed | Operational status is down Utilization > {$IF.UTIL.MAX}% Errors > {$IF.ERRORS.WARN} for 5 min Reported speed is lower than previous |
| Advantech ICR Mobile 1 SNMP | Fair mobile signal Weak mobile signal | Weak threshold < signal strength ≤ Fair threshold signal strength ≤ Weak threshold |
| Advantech ICR Resources by Agent (Active & Passive) | /etc/passwd changed {#STFILE} changed | MD5 checksum differs from previous MD5 checksum differs from previous |
Defined Zabbix triggers
Zabbix Web Configuration Structure
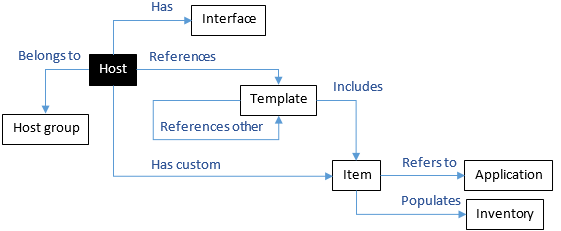
This section outlines the core components of a Zabbix configuration and how they interact to provide monitoring. Their relationships are illustrated in the figure below.
At the top level, monitored devices are defined as Hosts, which can be organized into Host groups for easier management of large infrastructures.
Individual checks performed on a host are defined as Items. Each item represents a specific metric (numeric or textual), collected using a defined method (e.g., SNMP, SSH, or agent) and update interval. Each item is identified by a unique key, such as system.cpu.load.
Items are organized using Tags (formerly known as Applications), which simplify filtering and categorization (e.g., Info, Status, Interfaces). Some items also populate host Inventory fields automatically (e.g., Name, OS, Serial Number).
Collected data is evaluated by Triggers, which define conditions for generating alerts. For visualization, Zabbix uses Graphs to display item values over time.
To simplify configuration, related entities (items, triggers, graphs, or discovery rules) can be grouped into a Template. Templates can be linked to hosts or nested within other templates to ensure consistent configuration across devices.
Importing Templates
To import templates into the Zabbix web interface, navigate to Data collection → Templates and click Import. Select the YAML template file and proceed with the import.
Tips
You can create custom templates tailored to your router and monitoring requirements. Existing items from Advantech templates can be reused to simplify configuration.
Using SNMP Polling
Router Configuration
For the Zabbix server to receive data via SNMP, the SNMP service must be enabled and properly configured on the router. Additionally, firewall rules must be configured to ensure that SNMP traffic can pass freely between the Zabbix server and the router.
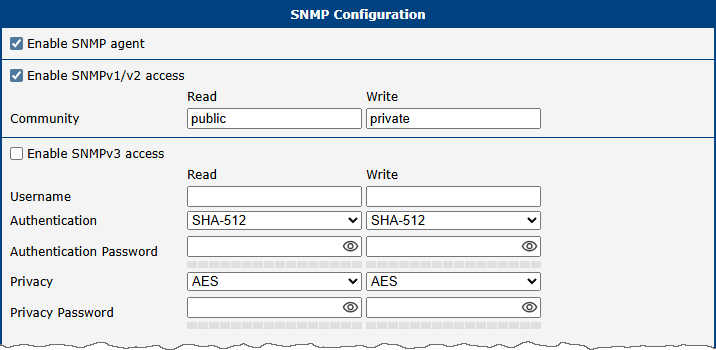
The figure below illustrates a minimal working configuration of the SNMP service on the router for SNMPv1/v2 access. The community string is set to public for Read access.
Warning
The default public community string should not be used in production environments.
Configuring a Host in Zabbix (SNMP)
Tips
This section describes a quick way to start monitoring an Advantech router using the SNMP interface. For more detailed information, refer to the official manuals at Zabbix Documentation.
The core logical configuration structure was described in the Zabbix Web Configuration Structure section. To add a router as a monitored host using SNMP:
This guide assumes that the Advantech YAML templates have already been imported into the Zabbix web interface under Data collection → Templates, as described in the Advantech Templates section.
In the Zabbix web interface, navigate to Monitoring → Hosts and click Create host. A New host configuration form appears. The figure below illustrates the configuration of a new host for SNMP data polling.
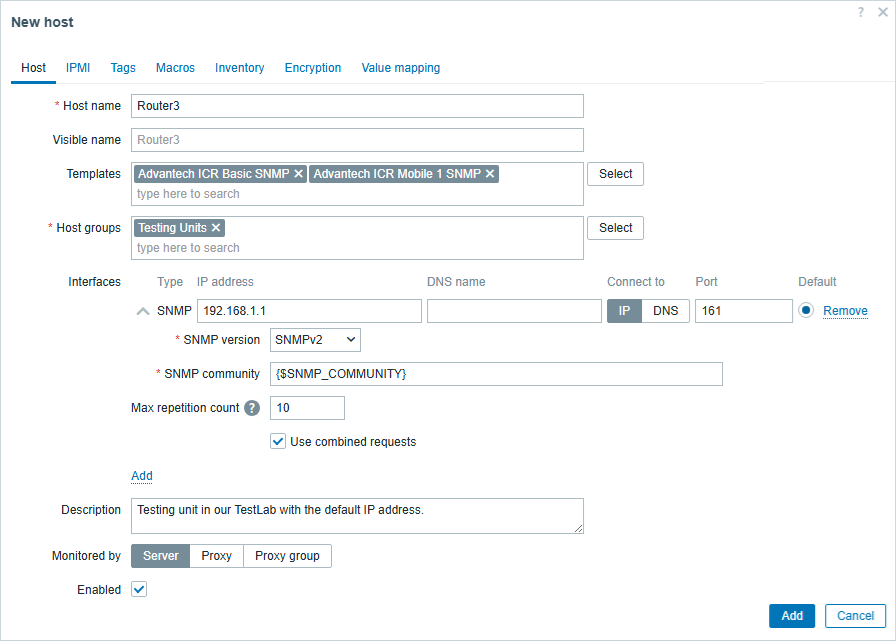
New host form with SNMP interface Fill in the following fields in the form:
Host name — An arbitrary but unique name for the host. This does not need to match the router's actual hostname. Use the Description field below for an optional detailed host description.
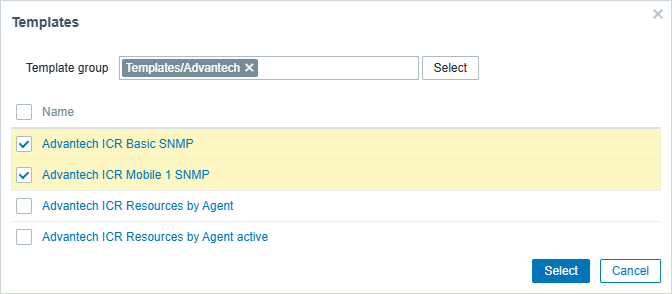
Templates — Choose the imported Advantech ICR Basic SNMP and/or Advantech ICR Mobile 1 SNMP template for SNMP data polling (you can filter for Advantech templates as shown in the figure below).
Choose template for SNMP Host groups — Select from existing host groups. You can create your own group in Data collection → Host groups.
Interfaces — Click Add and choose SNMP. The SNMP version should match the version configured on the router. The SNMP community string defaults to the
{$SNMP_COMMUNITY}macro, which is set topublicby default — matching the router configuration shown above.
Click the Add button at the bottom of the form to save the host.
If everything is configured correctly, after a few minutes you should see:
- In Monitoring → Hosts, the
SNMPlabel in the Availability column should turn green. - Retrieved status information in Monitoring → Latest data, filterable by your host name.
Tips
- Every item has a defined refresh rate, so some items may be populated later than others. To request an immediate update for a specific item, navigate to Data collection → Hosts, click Items on your host's row, select the item, and click Execute now.
- If data from hosts is not collected automatically, the SNMP poller on the Zabbix server may not be running or may be configured with an insufficient number of worker processes. Refer to the official Zabbix documentation for details about the
StartSNMPPollersparameter in the Zabbix server configuration file.
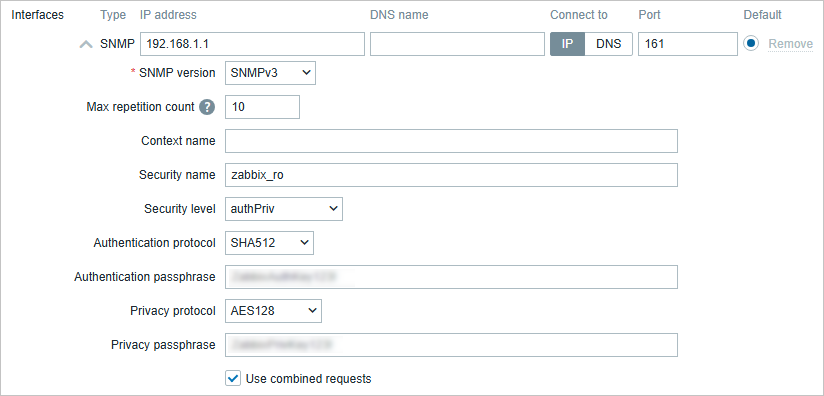
SNMPv3 Security Configuration
For production environments, SNMPv3 with authentication and privacy should always be used instead of SNMPv1/v2, which provide no encryption. Configure SNMPv3 with authentication and privacy on the router as shown in the figure below.
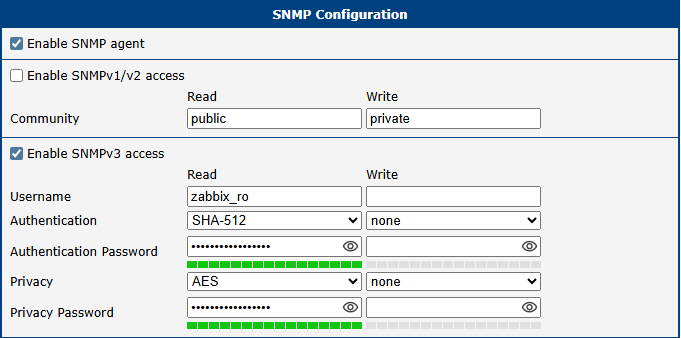
Next, in the Zabbix web interface, configure the corresponding encryption settings for the host's SNMP interface so that they exactly match the router's configuration.
Zabbix Agent Router App
The Zabbix Agent Router App provides monitoring of values not available through SNMP, supporting both active and passive checks. Compared to SNMP, the Zabbix Agent provides active checks, custom keys, and TLS-based communication. This app can be downloaded from the Zabbix Agent Router App page.
Router Configuration (Zabbix Agent)
First, install the Zabbix Agent Router App on the router. See the manual of your router, section Customization Pages → Router Apps, for instructions on how to upload a Router App.
In the Router App configuration, configure connectivity to the Zabbix server. There are two basic modes — passive and active — as described in the Possible Interfaces section.
The figure below shows the Router App configuration GUI.
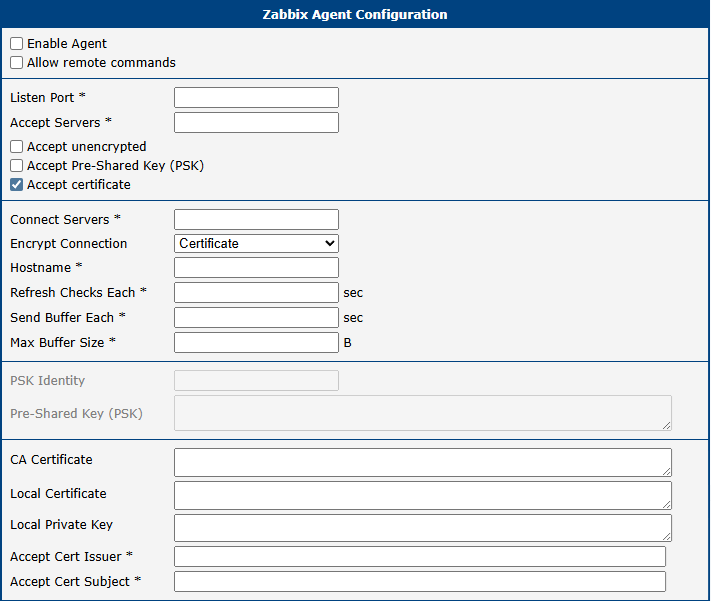
| Item | Description |
|---|---|
| Enable Agent | Enables or disables the Zabbix agent service on the router. |
| Allow Remote Commands | Specifies whether remote commands from the Zabbix server are permitted. When disabled, system.run checks will be rejected. |
| Listen Port | The port on which the agent (in passive mode) listens for connections from the server. Default: 10050. |
| Accept Servers | Incoming passive connections are accepted only from the IP addresses listed here. Enter the IP address of your Zabbix server. Multiple comma-separated addresses can be provided. If left empty, passive mode is disabled. |
| Accept unencrypted | Allows passive connections without encryption (not recommended). The encryption setting for the host on the Zabbix server should be set to No encryption (the default). |
| Accept Pre-Shared Key (PSK) | Allows passive connections secured with TLS and a Pre-Shared Key (PSK). When enabled, the PSK Identity and Pre-Shared Key (PSK) fields must be configured. The host's encryption on the Zabbix server must be set to PSK and configured accordingly. |
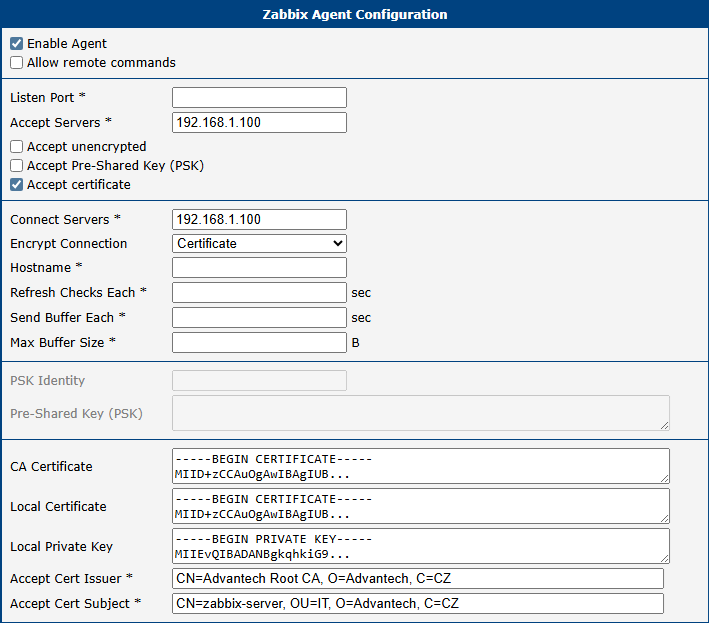
| Accept certificate | Allows passive connections secured with TLS and a certificate. When enabled, CA Certificate, Local Certificate, and Local Private Key must be configured. The host's encryption on the Zabbix server must be set to Certificate and configured accordingly. |
| Connect Servers | Specifies the connection to the Zabbix server (or servers) for active checks. Supported formats: IP:port, IP, hostname:port, or hostname. Multiple comma-separated addresses can be provided to use several independent Zabbix servers in parallel. If left empty, active checks are disabled. |
| Encrypt Connection | Specifies the encryption method the agent uses to connect to the Zabbix server. Must match the Connections from host setting in the Zabbix web interface. |
| Hostname | A unique hostname for the router. Must exactly match the Host name field configured in the Zabbix web interface. If not specified, the router's hostname is used (defined in Configuration → System → Identification). |
| Refresh Checks Each | How often (in seconds) the agent retrieves the list of active checks from the Zabbix server. Default: 10 seconds. |
| Send Buffer Each | Time interval (in seconds) for syncing buffered check results to the Zabbix server. Default: 5 seconds. |
| Max Buffer Size | Maximum size of the buffer. When this capacity is reached, the agent syncs buffered values to the server immediately. Default: 100. |
| PSK Identity | The pre-shared key identity string. Must match the PSK identity field in the Zabbix web interface. The same PSK identity is used for both passive and active checks. |
| Pre-Shared Key (PSK) | The pre-shared key string. Must match the PSK field in the Zabbix web interface. |
| CA Certificate | The CA certificate chain of the authority that issued the Zabbix server certificates. |
| Local Certificate | The certificate of the router, corresponding to its private key. The certificate purpose must include "client authentication". If generated via OpenSSL, extendedKeyUsage = clientAuth must be set. The CA certificate of the issuing authority must be included in the TLSCAFile on the Zabbix server. |
| Local Private Key | The private key of the router. The same private key and certificates are used for both passive and active checks. |
| Accept Cert Issuer | The allowed server certificate issuer. If specified, must match the issuer of the server's certificate. |
| Accept Cert Subject | The allowed server certificate subject. If specified, must match the subject of the server's certificate. |
Zabbix agent configuration items
Tips
Log messages for this Router App can be viewed in the system log under Status → System Log.
Configuring a Host in Zabbix (Agent)
Tips
This section describes a quick way to start monitoring an Advantech router using the Agent interface. For more detailed information, refer to the official manuals at Zabbix Documentation.
To add a router as a monitored host using the Agent interface:
This guide assumes that the Advantech YAML templates have already been imported into the Zabbix web interface under Data collection → Templates, as described in the Advantech Templates section.
In the Zabbix web interface, navigate to Monitoring → Hosts and click Create host. The figure below illustrates the configuration of a new host for agent-based monitoring using the active agent template.
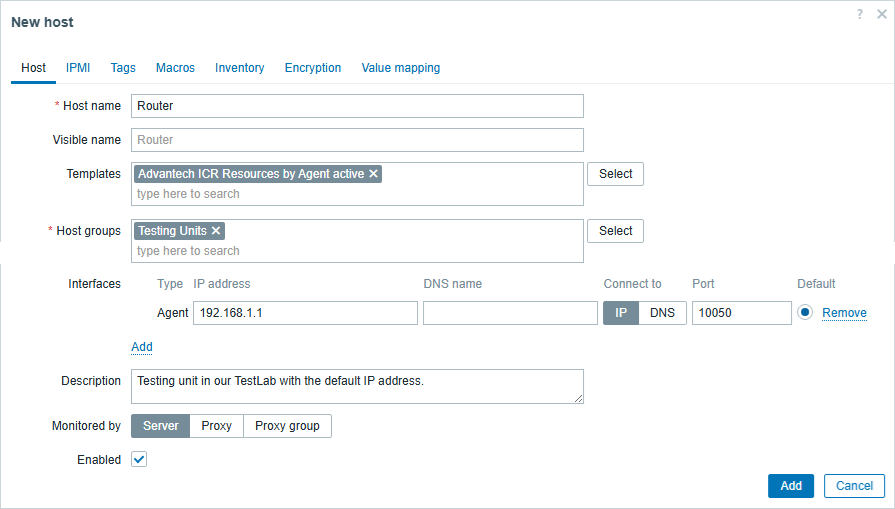
New host form with active agent interface Fill in the following fields in the form:
Host name — The host name, which must exactly match the router's actual hostname. The router's default hostname is
Router, but it can be configured under Configuration → System → Identification. Use the Description field for an optional detailed description.Templates — Choose the Advantech ICR Resources by Agent template for passive monitoring, or the Advantech ICR Resources by Agent active template for active monitoring (you can filter for Advantech templates as shown below).
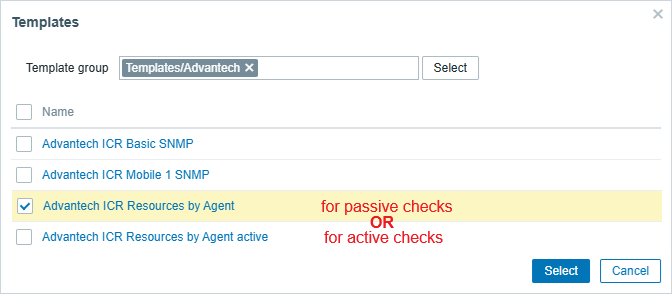
Choose template for active checks Host groups — Select from existing host groups. You can create your own group in Data collection → Host groups.
Interfaces — Click Add and choose Agent.
Click the Add button at the bottom of the form to save the host.
If everything is configured correctly, after a few minutes you should see:
- In Monitoring → Hosts, the
ZBX(Agent) label in the Availability column should turn green. - Retrieved status information in Monitoring → Latest data, filterable by your host name.
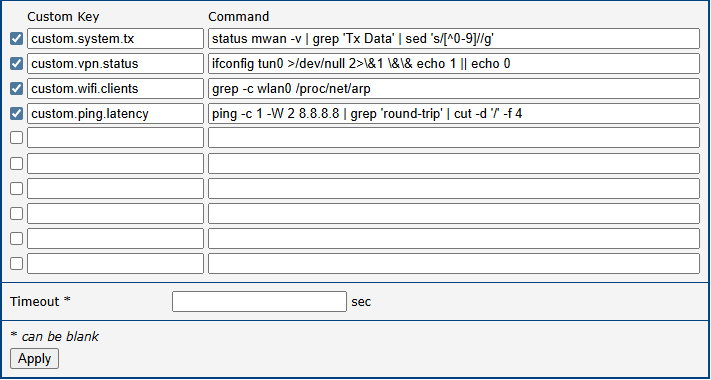
Custom Keys Configuration
In addition to the standard items, you can define custom items to be monitored in either active or passive mode. Custom item configuration is located in the bottom part of the configuration screen.
| Item | Description |
|---|---|
| Custom Key | The key for the custom Zabbix item. |
| Command | The command to execute, including any optional arguments (single command, single line). The command is executed and the first line of stdout is used as the resulting value. Double quotes " are not allowed; dollar signs $ must be escaped as \$. For more complex checks, create a shell script and call it from this field. |
| Timeout | Limits the execution time of a single check. Default: 3 s. |
Zabbix agent custom key configuration
The figure above shows examples of custom keys. The table below describes the example custom keys and their data types:
| Key | Description | Type |
|---|---|---|
custom.system.tx | Amount of transmitted data on the mobile WAN interface (TX). | Numeric (integer) |
custom.vpn.status | Status of the VPN tunnel (1 = up, 0 = down). | Numeric (integer) |
custom.wifi.clients | Number of connected Wi-Fi clients. | Numeric (integer) |
custom.ping.latency | Network latency to the specified host (in milliseconds). | Numeric (float) |
Custom keys examples
Adding a Custom Key to Zabbix
Once a Custom Key is defined on the router, configure the Zabbix server to collect its data by adding a new Item to the corresponding Host or Template:
- Navigate to Data collection → Hosts (or Templates).
- Click the Items link in the row of your Advantech router.
- Click the Create item button in the top-right corner.
- Fill in the required parameters:
- Name: A descriptive name (e.g., WiFi Clients Count).
- Type: Select Zabbix agent (for passive checks) or Zabbix agent (active) depending on the router's agent configuration.
- Key: Enter the exact Custom Key defined on the router (e.g.,
custom.wifi.clients). - Type of information: Select the data type matching the command's output — Numeric (unsigned) for counts/statuses, Numeric (float) for latency, or Character for text strings.
- Update interval: How often the server should poll this item (e.g.,
1mor5m).
- Click Add to save the configuration.
Tips
The Key field in the Zabbix frontend must exactly match the Custom Key string defined in the router's agent configuration. Otherwise, the Zabbix server will report the item as "Not supported".
Agent TLS Configuration
In a production environment, it is highly recommended to use encryption for the connection, either by using a Pre-Shared Key (PSK) or a CA certificate.
PSK Encryption
An example configuration in the Zabbix Agent Router App with only PSK encryption enabled is shown below. It is configured for both passive and active checks.
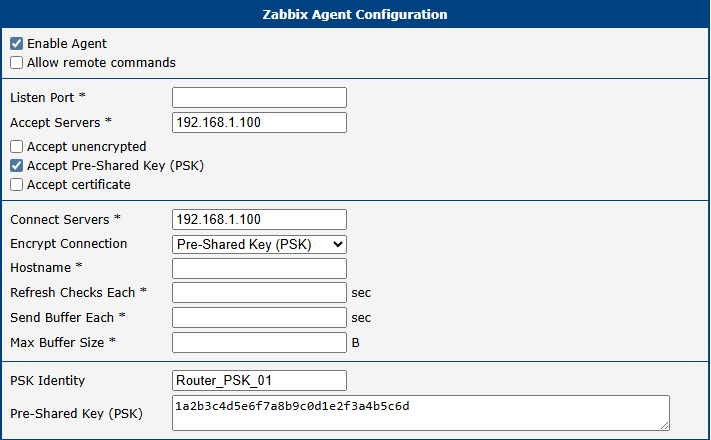
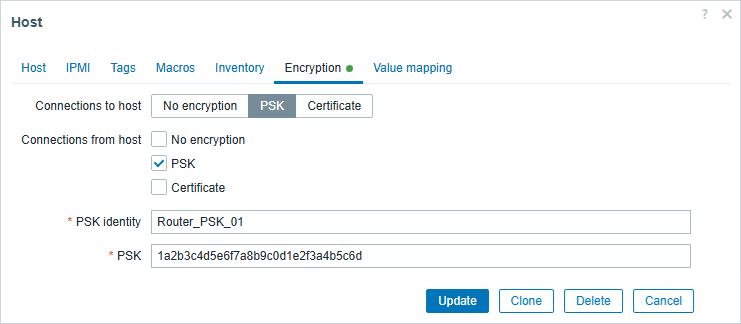
In the Zabbix web interface, configure the corresponding encryption settings for the host's Agent interface so that they exactly match the router's configuration.
CA Certificate Encryption
The highest level of security is achieved using TLS certificate authentication (mTLS). An example configuration in the Zabbix Agent Router App with only CA Certificate encryption enabled is shown below. It is configured for both passive and active checks.
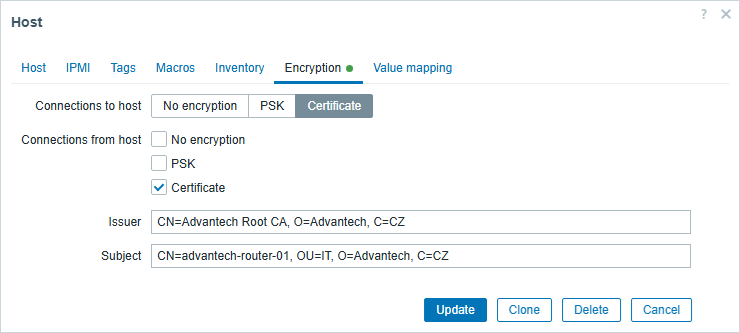
In the Zabbix web interface for the host configuration, add an Agent Interface, define encryption settings to align with the agent's configuration, and link the host to one or more Agent templates.
To use TLS certificates, the Zabbix server needs its own certificates (TLSCAFile, TLSCertFile, and TLSKeyFile) set up as described in the Zabbix Manual:
https://www.zabbix.com/documentation/current/manual/encryption/using_certificates
Warning
- Configuring certificates in the Zabbix web interface only defines verification rules. For TLS encryption to work, the Zabbix server must have its own certificate, private key, and CA certificate physically stored on its filesystem, referenced in
zabbix_server.confusing theTLSCAFile,TLSCertFile, andTLSKeyFileparameters. Refer to the official Zabbix documentation for detailed instructions. - The purpose of the certificate must include "server authentication". When generated by OpenSSL, the
extendedKeyUsage = serverAuthattribute must be set.
Items Supported by Zabbix Agent
Standard Zabbix item descriptions are available at:
https://www.zabbix.com/documentation/current/manual/config/items/itemtypes/zabbix_agent
Platform support information is available at:
https://www.zabbix.com/documentation/6.0/en/manual/appendix/items/supported_by_platform
The following table indicates which standard agent items are supported on Advantech cellular routers:
| Item Key | Support |
|---|---|
agent.hostname | Both |
agent.ping | Both |
agent.variant | Both |
agent.version | Both |
kernel.maxfiles | Both |
kernel.maxproc | Both |
kernel.openfiles | Both |
log[file,<regexp>,<encoding>,<maxlines>,<mode>,<output>,<maxdelay>] | Active only |
log.count[file,<regexp>,<encoding>,<maxproclines>,<mode>,<maxdelay>] | Active only |
logrt[file_regexp,<regexp>,<encoding>,<maxlines>,<mode>,<output>,<maxdelay>,<options>] | Active only |
logrt.count[file_regexp,<regexp>,<encoding>,<maxproclines>,<mode>,<maxdelay>,<options>] | Active only |
net.dns[<ip>,name,<type>,<timeout>,<count>,<protocol>] | Both |
net.dns.perf[<ip>,name,<type>,<timeout>,<count>,<protocol>] | Both |
net.dns.record[<ip>,name,<type>,<timeout>,<count>,<protocol>] | Both |
net.if.collisions[if] | Both |
net.if.discovery | Both |
net.if.in[if,<mode>] | Both |
net.if.list | Both |
net.if.out[if,<mode>] | Both |
net.if.total[if,<mode>] | Both |
net.tcp.listen[port] | Both |
net.tcp.port[<ip>,port] | Both |
net.tcp.service[service,<ip>,<port>] | Both |
net.tcp.service.perf[service,<ip>,<port>] | Both |
net.tcp.socket.count[<laddr>,<lport>,<raddr>,<rport>,<state>] | Both |
net.udp.listen[port] | Both |
net.udp.service[service,<ip>,<port>] | Both |
net.udp.service.perf[service,<ip>,<port>] | Both |
net.udp.socket.count[<laddr>,<lport>,<raddr>,<rport>,<state>] | Both |
proc.cpu.util[<name>,<user>,<type>,<cmdline>,<mode>,<zone>] | Both |
proc.get[<name>,<user>,<cmdline>,<mode>] | Both |
proc.mem[<name>,<user>,<mode>,<cmdline>,<memtype>] | Both |
proc.num[<name>,<user>,<state>,<cmdline>,<zone>] | Both |
proc.info[process,<attribute>,<type>] | Both |
system.boottime | Both |
system.cpu.discovery | Both |
system.cpu.intr | Both |
system.cpu.load[<cpu>,<mode>] | Both |
system.cpu.num[<type>] | Both |
system.cpu.switches | Both |
system.cpu.util[<cpu>,<type>,<mode>] | Both |
system.hostname | Both |
system.hw.cpu[<cpu>,<info>] | Both |
system.hw.macaddr[<interface>,<format>] | Both |
system.localtime[<type>] | Passive only |
system.run[command,<mode>] | If enabled |
system.sw.arch | Both |
system.sw.os[<info>] | Both |
system.sw.os.get | Both |
system.uname | Both |
system.uptime | Both |
vfs.dir.count[dir,<regex_incl>,<regex_excl>,<types_incl>,<types_excl>,<max_depth>,<min_size>,<max_size>,<min_age>,<max_age>] | Both |
vfs.dir.get[dir,<regex_incl>,<regex_excl>,<types_incl>,<types_excl>,<max_depth>,<min_size>,<max_size>,<min_age>,<max_age>,<regex_excl_dir>] | Both |
vfs.dir.size[dir,<regex_incl>,<regex_excl>,<mode>,<max_depth>] | Both |
vfs.file.cksum[file] | Both |
vfs.file.contents[file,<encoding>] | Both |
vfs.file.exists[file,<types_incl>,<types_excl>] | Both |
vfs.file.get[file] | Both |
vfs.file.md5sum[file] | Both |
vfs.file.owner[file,<ownertype>,<resulttype>] | Both |
vfs.file.permissions[file] | Both |
vfs.file.regexp[file,regexp,<encoding>,<output>] | Both |
vfs.file.regmatch[file,regexp,<encoding>] | Both |
vfs.file.size[file] | Both |
vfs.file.time[file,<mode>] | Both |
vfs.fs.discovery | Both |
vfs.fs.size[fs,<mode>] | Both |
vm.memory.size[<mode>] | Both |
web.page.get[host,<path>,<port>] | Both |
web.page.perf[host,<path>,<port>] | Both |
web.page.regexp[host,<path>,<port>,regexp,<length>,<output>] | Both |
Agent items support
In addition, the following Advantech-specific items are supported:
| Item Key | Description |
|---|---|
vfs.settings.discovery | List of /etc/settings.* and /opt/*/etc/settings files for auto-discovery. |
vfs.settings.value[name,parameter] | Retrieves a single value from the router configuration /etc/settings.[name]. Example: vfs.settings.value[wifi_ap, WIFI_AP_SSID] |
vfs.settings.umod[name,parameter] | Retrieves a single value from a Router App configuration /opt/[name]/etc/settings. Example: vfs.settings.umod[gps, MOD_GPS_ENABLED] |
Advantech-specific items
Troubleshooting
Problems are organized by observed symptom to help quickly identify the root cause.
| Symptom | Likely Cause |
|---|---|
| No data | Incorrect interface configuration or missing template |
| Host unavailable | Network connectivity issue or firewall blocking communication |
| Items not supported | Incorrect item key or missing feature on the router |
No Data in Zabbix
If no data is displayed in Monitoring → Latest data, check the following:
- Verify that the host is correctly configured in the Zabbix web interface.
- Ensure that the correct template is assigned to the host.
- Check network connectivity between the router and the Zabbix server (e.g., using
ping). - Confirm that the selected interface type (SNMP or Agent) matches the router configuration.
- Verify that item update intervals are not too long.
Host Not Available
If the host shows as unavailable (red indicator):
- Verify that the IP address or hostname is correct.
- Check firewall rules on both the router and the server.
- Ensure that required ports are open:
- SNMP: UDP 161
- Zabbix Agent: TCP 10050 (passive) or TCP 10051 (active)
- Confirm that the monitoring service (SNMP or Agent) is enabled on the router.
SNMP Issues
SNMP Not Responding
- Ensure that the SNMP service is enabled on the router.
- Verify that the SNMP version configured in Zabbix matches the router.
- Check that the community string (SNMPv1/v2) or credentials (SNMPv3) are correct.
- Test SNMP manually using tools such as
snmpwalk.
SNMPv3 Authentication Errors
- Verify that authentication and privacy settings match exactly on both sides.
- Ensure that the same authentication protocol (e.g., SHA-512) and encryption method (e.g., AES) are used.
- Check username and passwords for typos.
Zabbix Agent Issues
Agent Not Connecting
- Verify that the Zabbix Agent Router App is installed and running.
- Check the Connect Servers configuration for active checks.
- Ensure that the router can reach the Zabbix server (network routing, NAT).
- Verify that the Hostname matches the host name configured in Zabbix exactly.
Passive Checks Not Working
- Ensure that the Zabbix server IP address is listed in Accept Servers.
- Verify that the correct port (default 10050) is open and listening.
- Check firewall settings on the router.
Items Marked as "Not Supported"
- Verify that the item key is correct and matches the router configuration.
- Ensure that required features or Router Apps are installed.
- Check for syntax errors in custom commands.
- Review Zabbix server logs for detailed error messages.
Encryption Issues
PSK Authentication Fails
- Ensure that the PSK identity and key match exactly on both the router and server.
- Check that the correct encryption mode (PSK) is selected in the Zabbix host configuration.
Certificate Authentication Fails
- Verify that the CA certificate is trusted on both sides.
- Ensure that certificate subject and issuer fields match the configuration.
- Confirm that the certificate includes the correct purpose (client/server authentication).
- Check that certificate files are correctly configured on the Zabbix server (
TLSCAFile,TLSCertFile,TLSKeyFile).
Performance Issues
- Reduce item polling frequency if the server is overloaded.
- Increase the number of SNMP pollers in the Zabbix server configuration.
- Prefer active agent checks for large deployments.
Log Analysis
Logs are essential for troubleshooting:
- Zabbix server logs (e.g.,
/var/log/zabbix/zabbix_server.log) - Router system log (Status → System Log)
Review logs for errors related to connectivity, authentication, or unsupported items.